Storytelling with Data
Estimated reading time: 3 minutes
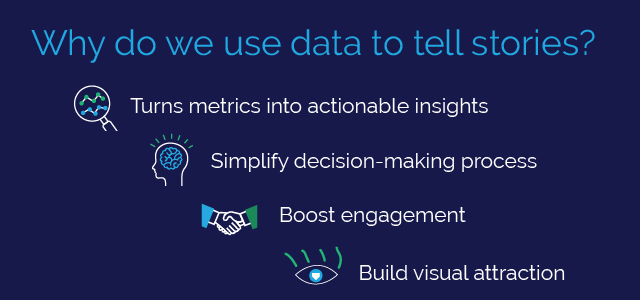
Data is more than a trending topic. Today, data drives business solutions and tells a story about what is happening in your business. Whether manufacturers are using data to pinpoint defects or downtime in their machines, retailers are analyzing their new loyalty programs, or a healthcare provider is monitoring patient engagement, data tells a story. When data is presented in a digestible format filled with fact-based information, stakeholders can “see” what is happening so they can make concrete decisions to benefit the business.
Not only does incorporating data into presentations and stories build credibility, but visual data also is intriguing and gives you an opportunity to connect with your audience. Presenting statistics to a group of people can be overwhelming. Large decks packed with numbers without context can quickly disinterest your audience. Your data should be engaging. Here’s how to get there:
- Data Collection (Campaign, testing, survey, etc.)
- Data Preparation (Collect insights from collection source, clean the data)
- Data Analysis (Now it is time to analyze the data, what is it saying?)
- Data Presentation (Present data to decision-makers and stakeholders)
- Data Deployment (Apply newly learned metrics)
Build Your Data Story
Build your data analysis as a story. After you dig into the insights, determine the important factors. What do you want stakeholders to take away from the presentation? What should be done as a result? Are you pitching an idea or proving that another solution is better? Either way, actionable, visually intriguing data is on your side.
Yes, data can be cut and dry, but that does not mean it cannot be personable. You may be presenting to your CMO or other important stakeholders, but the story should have an emotional appeal incorporated with authenticity and facts.
Pictures, graphs, charts, and more graphs! Platforms like Tableau CRM™ allow you to pull data from multiple sources into one centralized place. From there, it works to spot opportunities, trends, and outcomes to overcome major challenges. Using colorful visuals, Tableau makes it easy to share visualizations with the team. Plus, Tableau seamlessly integrates with Salesforce®, so data can be woven into every action and decision taken.
Just as we have for many businesses, the AdVic Consulting Team can help your business, regardless of industry, incorporate Tableau into your technology stack to empower you with the critical insights you need. Book a meeting with us today. Pick your day and time below, or click here to contact us!
Related Resources:
Examples of How Dashboards and Data Solve Business Problems
The Difference Between Tableau and Tableau CRM
The Analytics Powers Inside Salesforce Tableau CRM and Tableau