Examples of How Dashboards and Data Solve Business Problems
Estimated reading time: 8 minutes
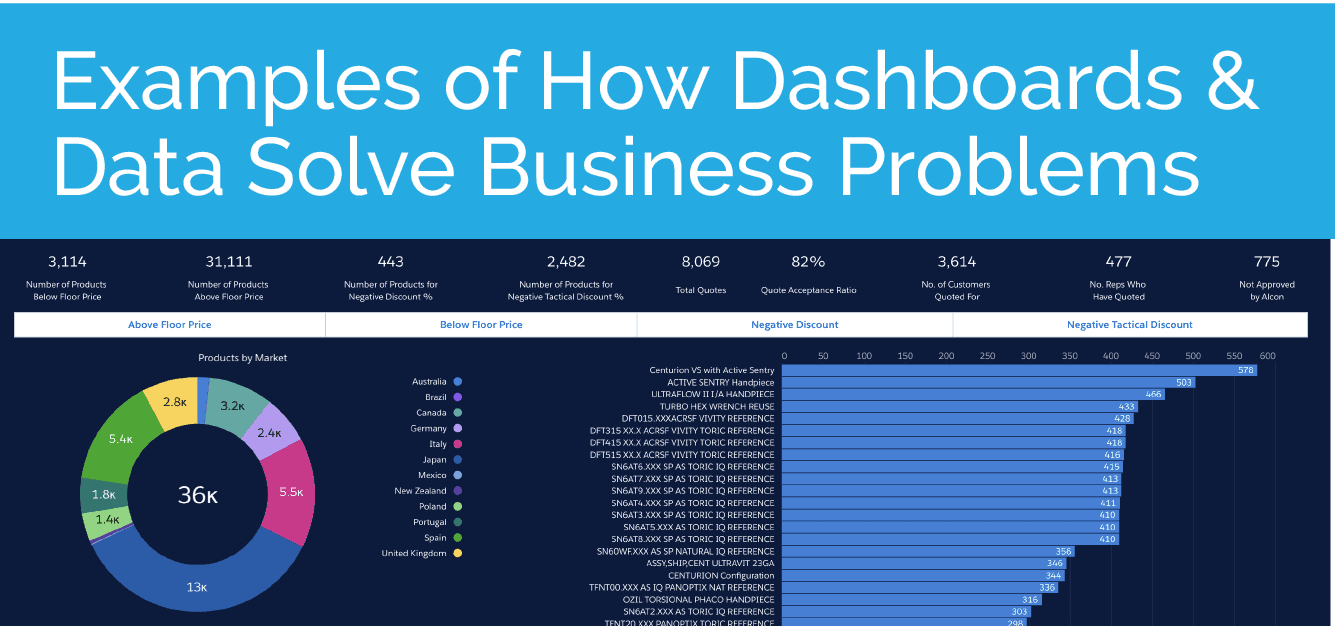
Any successful business knows that in order to find and solve problems, you have to start by looking at your data. With all of the technology out there – including Salesforce® – the hard part isn’t getting access to the data you need – it’s analyzing and interpreting your data, and then understanding how your analysis will translate into solutions to your business problems.
So, what do you need to analyze and interpret your data? A really good dashboard.
There are a couple of different ways to approach using data analysis to uncover business problems. Some of you may already have a problem you know about or have a hunch about – which, in a sense, isn’t the worst scenario to be in. If you’re aware of an existing issue, you have a great starting point for a dashboard.
Example 1: Starting with a Known Problem
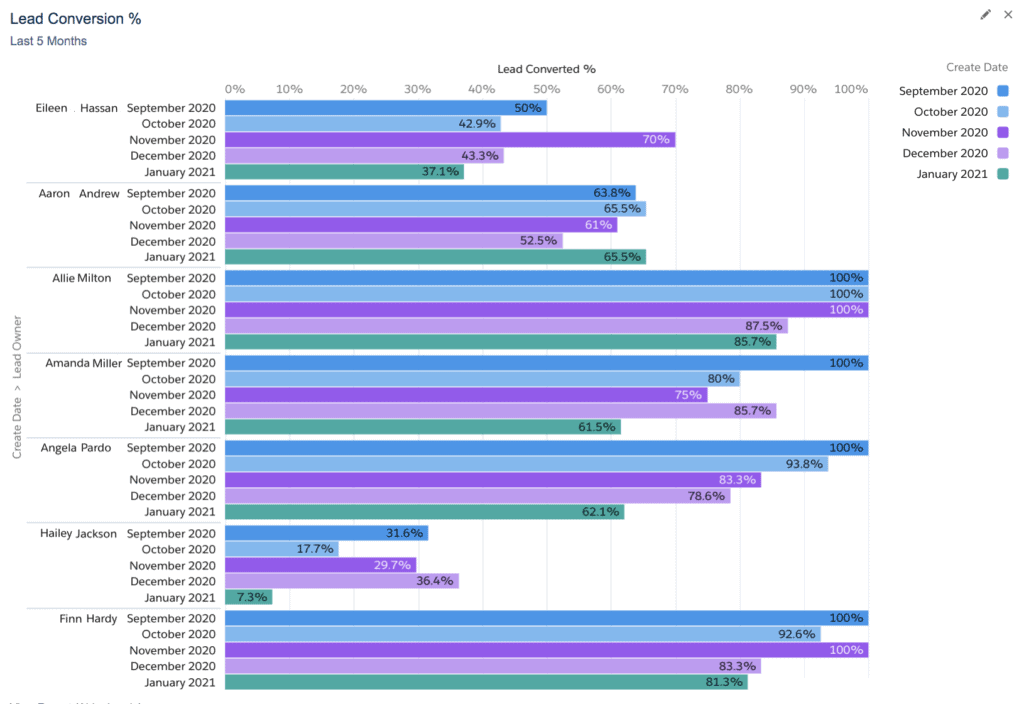
The last couple months, Roger (a Sales Manager) has noticed a slight drop in the number of leads converted by his sales team. Roger’s team hasn’t changed in size at all and he hasn’t noticed a drastic change in work ethic or engagement from any of his sales reps. He has confronted each of his sales reps about the change of pace – his team had no possible explanation for the shift in conversion rates and suggested the pandemic and other external factors may be playing a role. While this may be true, Roger knows that analyzing patterns and trends for the data he has access to in Salesforce will tell him more about what could be causing this.
The dashboard doesn’t create itself, so Roger needs to start with creating relevant and meaningful visualizations to learn more about a variety of lead conversion patterns. Although he may find a pattern in one of the first graphs he creates, it is important that the dashboard is created with all possible visualizations that may help him down the road, such as if this problem ever resurfaces or if he ever needs guidance on how to maximize lead conversion. This dashboard will provide him with a number of different trends and patterns he can drill into. The final result of the dashboard includes the following:
- Lead Conversion Rates and Converted Leads by Sales Rep: This graph will be useful if there’s ever someone on the team who isn’t pulling their weight.
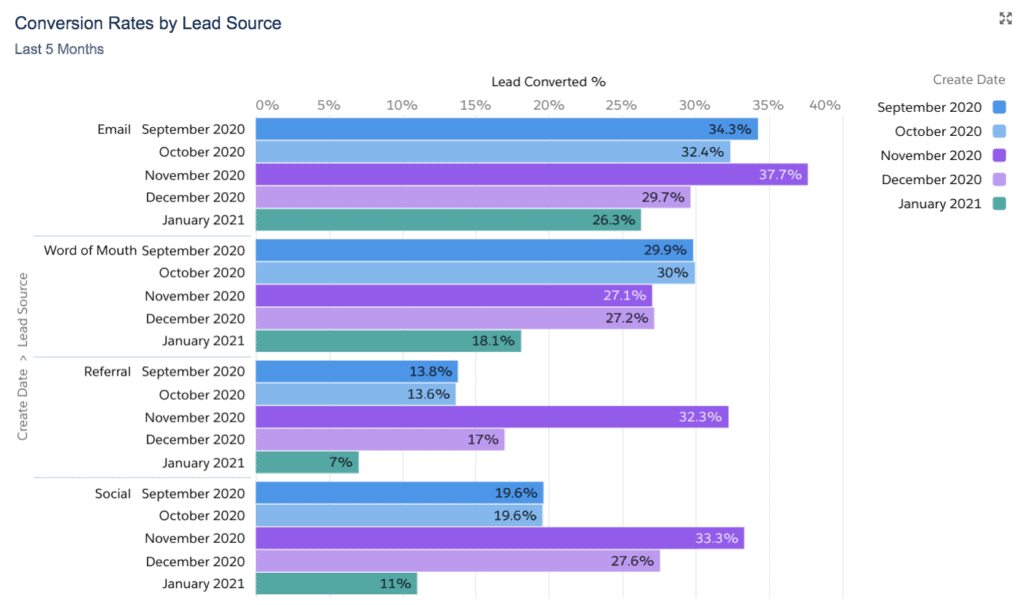
- Lead Conversion Rates and Converted Leads by Lead Source: Leads can come into Salesforce a number of different ways, which almost always plays a role in how quickly Leads are converted and how many Leads are converted.
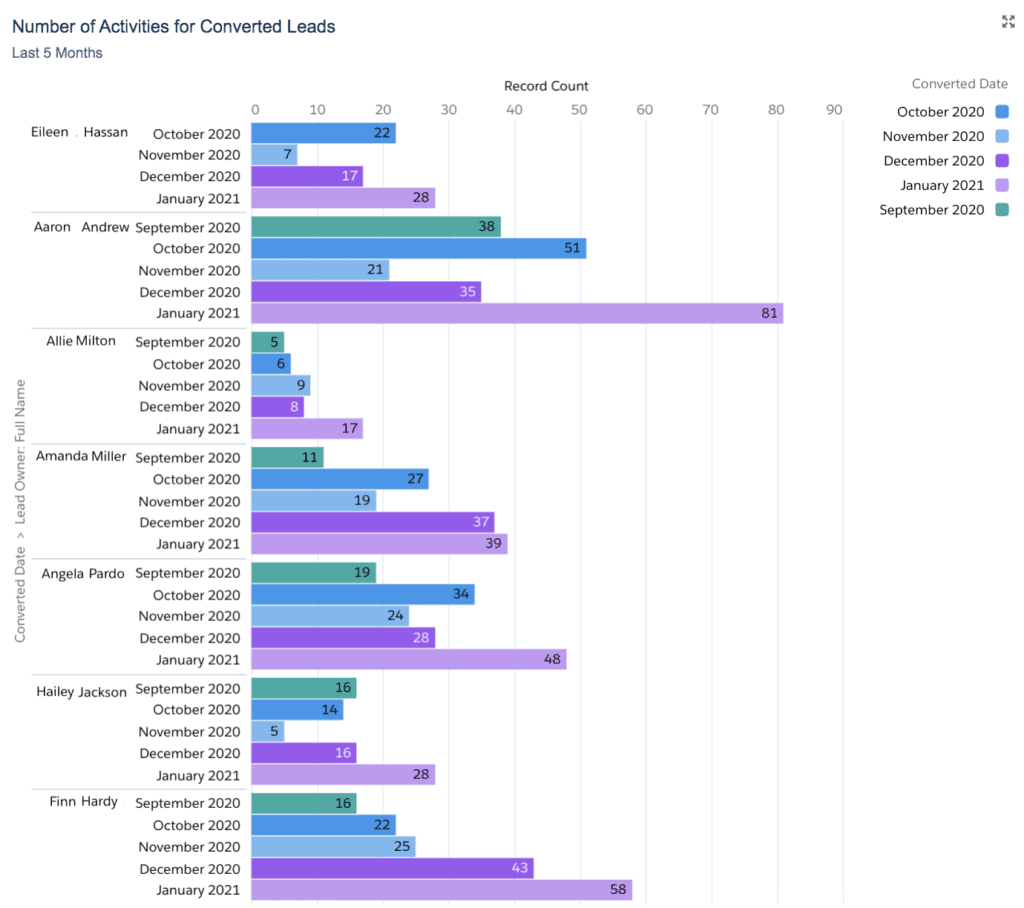
- Activities Logged for Converted Leads: If your company relies heavily on outreach to prospects, it’s likely that you have taken advantage of Salesforce Activities. How often a Lead is “worked” typically correlates to the likelihood of that lead converting.
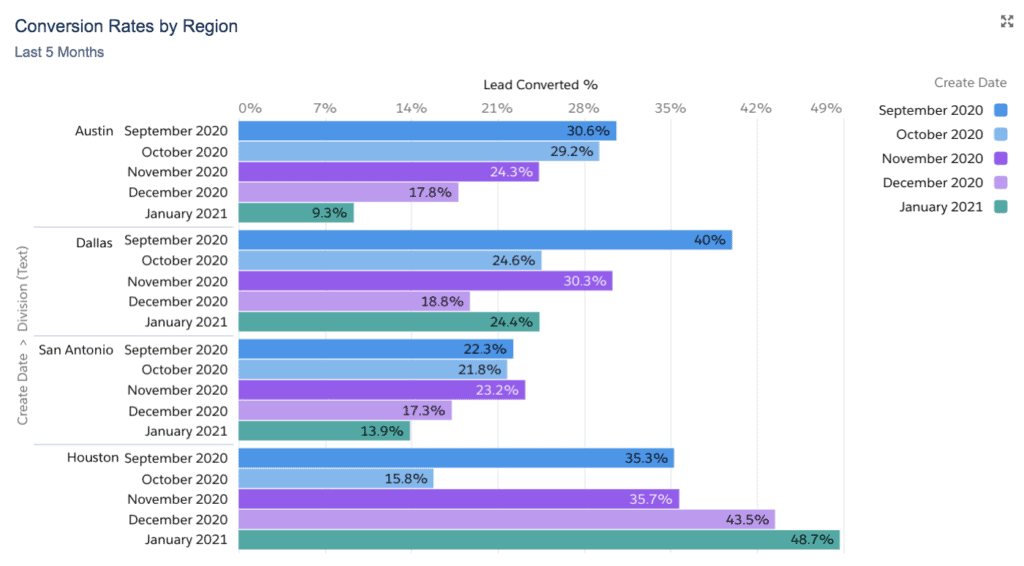
- Lead Conversion Rates and Converted Leads by Region: If the problem is isolated to a specific region, it’s likely that you will need some market data to really confirm that this is, in fact, an external problem and not a business problem.
- Lead Age by Sales Rep, Lead Source: Analysis on Lead Age may tell you that the real problem is caused by leads taking longer to convert, which, in turn, is affecting your lead conversion rates.
Roger learns a lot about his day-to-day business from this dashboard – lead conversion rates have dropped pretty consistently across his sales reps and lead sources. He does notice, however, that the number of activities logged has actually increased over the last couple months. In reviewing the activity data and the notes for activities logged, Roger sees that a lot of calls to leads have not been returned compared to how many used to be returned. His company recently implemented a new automated phone system – shortly before his conversion rates started to drop. He comes up with an action plan:
- Determine the amount of time it takes to reach an Account Manager using the new automated phone system vs. how long it took before the automated phone system was implemented.
- Request feedback on the company’s new automated phone system in the next survey that is sent out to existing customers.
- Encourage his team members to focus more heavily on email campaigns or to provide leads with their own personal office line number for communication.
- Monitor lead conversion activity over the next couple of weeks to see if there’s any difference.
The dashboard will never tell you exactly what to do – it will surface patterns and lead you to take away actionable insights that will address your everyday business problems.
Example 2: Starting with No Known Problems
The more challenging scenario for businesses is when you have no known problem to solve for. Even the sales rep at the top of the leaderboard has something he or she can do better. There are always ways to improve. For this scenario, a more sophisticated data model may be a better fit than a standard Salesforce or Tableau CRM dashboard.
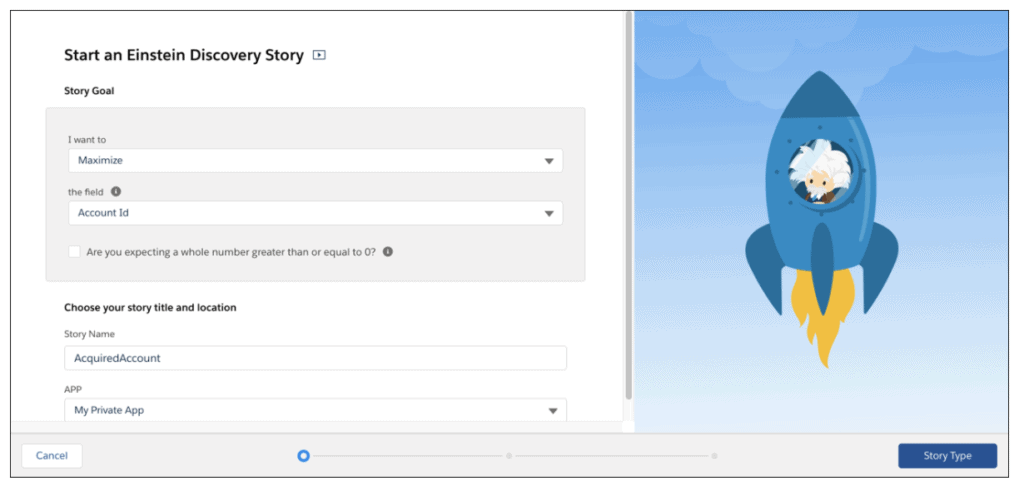
Einstein Discovery is AI-powered analytics that enables Salesforce users to uncover relevant patterns based on their historical data. Yes, this type of technology and depth of analysis is intimidating. Salesforce, however, has designed this tool so that little-to-no statistics background is required. The Einstein Discovery wizard prompts you to select an outcome that you would want to maximize or minimize and automatically tells you how other variables contributed to this outcome. An outcome can be something like maximizing Opportunity Amount or minimizing Opportunity Age. The results of the analysis are presented in the form of a Story.
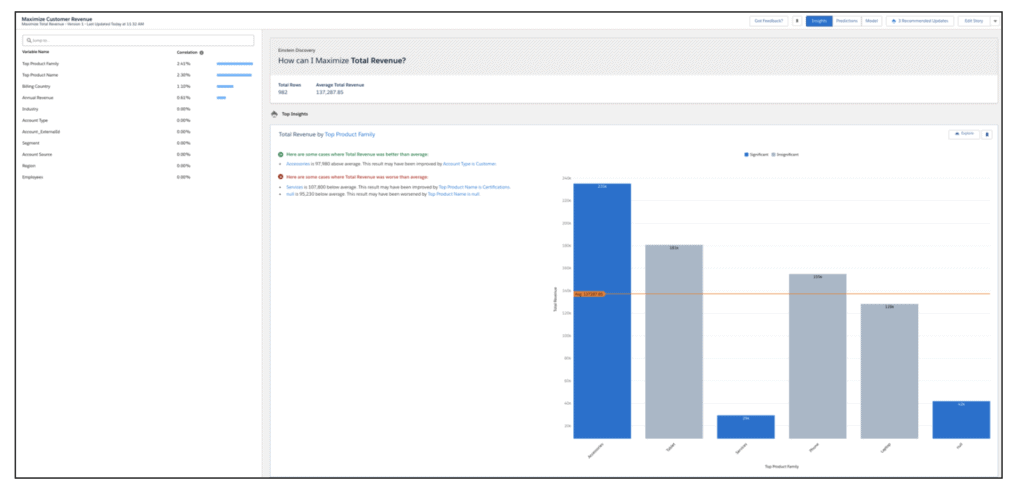
The results of the Einstein Discovery Story start with telling you what happened. These are descriptive analytics that highlight patterns and specific factors that most influenced your outcome. Often, patterns are surfaced here that you may not even know about.
The Story also tells you why it happened – these are predictive analytics that reveal why it happened (diagnostic insights), what could happen (predicted future outcomes based on statistical probabilities), and what is the difference between variables (comparative insights).
And lastly, the Story will tell you what could have happened: prescriptive analytics that suggest ways in which to improve your predicted outcomes. This section allows the user to change variables within their data to determine the future impact on the outcome.
Once analyzed and refined, the Einstein Discovery Story can be applied to your present-day data. Based on the model, Einstein Discovery can provide a prediction for Amount for all your open Opportunities. It will assess characteristics about each Opportunity and compare it to what patterns and factors correlate most with a higher Opportunity Amount. Einstein Discovery can provide a prediction on what the finalized Amount will be and can provide recommendations for increasing that Amount.
Example: Setting your Outcome in Einstein Discovery
Example: Review Your Einstein Discovery Story
Whether it is through data analysis in a dashboard or by machine learning, one should never underestimate how much your data can tell you about your business. It tells you what you’re doing right and should keep, it tells you what might not be working as well as you think, and it tells you what is hurting your business.
Bottom line, build compact dashboards and data models to give you the confidence you need moving forward to make actionable insights.
If you’re striving for a way to securely transform and share your data in powerful, interactive dashboards, so everyone in your organization can ask and answer their own questions right from a browser, tablet or phone, and get it done without hours of coding or waiting on your IT team, you need to speak with Ad Victoriam today!
Related Resource:
The Analytics Power Inside Salesforce Tableau CRM and Tableau (Podcast)
Subscribe to the AdVic Salesforce Blog on Feedly: