15 Tips for Awesome Salesforce Reports and Dashboards
Estimated reading time: 5 minutes
These days, data reigns supreme, and organizations rely heavily on data to make informed decisions and drive business growth, and the Salesforce® CRM platform plays a crucial role in helping businesses manage their data. However, simply collecting data isn’t enough; you need to harness it effectively to derive valuable insights.
In this Ad Victoriam Salesforce Blog, we’ll explore 15 tips on creating effective Salesforce reports and dashboards, data visualization best practices, and how to extract valuable insights from Salesforce data.
Creating Effective Reports and Dashboards
Reports and dashboards are essential tools for visualizing and analyzing data within Salesforce. Here are some tips to create effective reports and dashboards:
1: Have a Plan
Before you start creating reports and dashboards, identify the specific objectives you want to achieve. Understand the key questions you need to answer or the insights you want to gain. This clarity will guide your data selection and visualization choices.
2: Pick the Right Report Type
Salesforce has different report types, like tables or summaries. Choose the one that fits your data and goals.
3: Organize Data with Filters
Filters help you narrow down the data to focus on what’s relevant. Use filters to restrict records based on criteria like date ranges, record types, or custom fields. This ensures that your reports provide meaningful insights.
4: Utilize Custom Report Types
If your organization has unique data requirements, consider creating custom report types. Custom report types allow you to define which objects and fields are accessible for reporting, giving you more control over the data you analyze.
5: Group and Summarize Data
To derive insights quickly, use grouping and summarizing features. Group data by fields such as account owner, product, or region, and add summaries like totals or averages. This makes complex data more understandable at a glance.
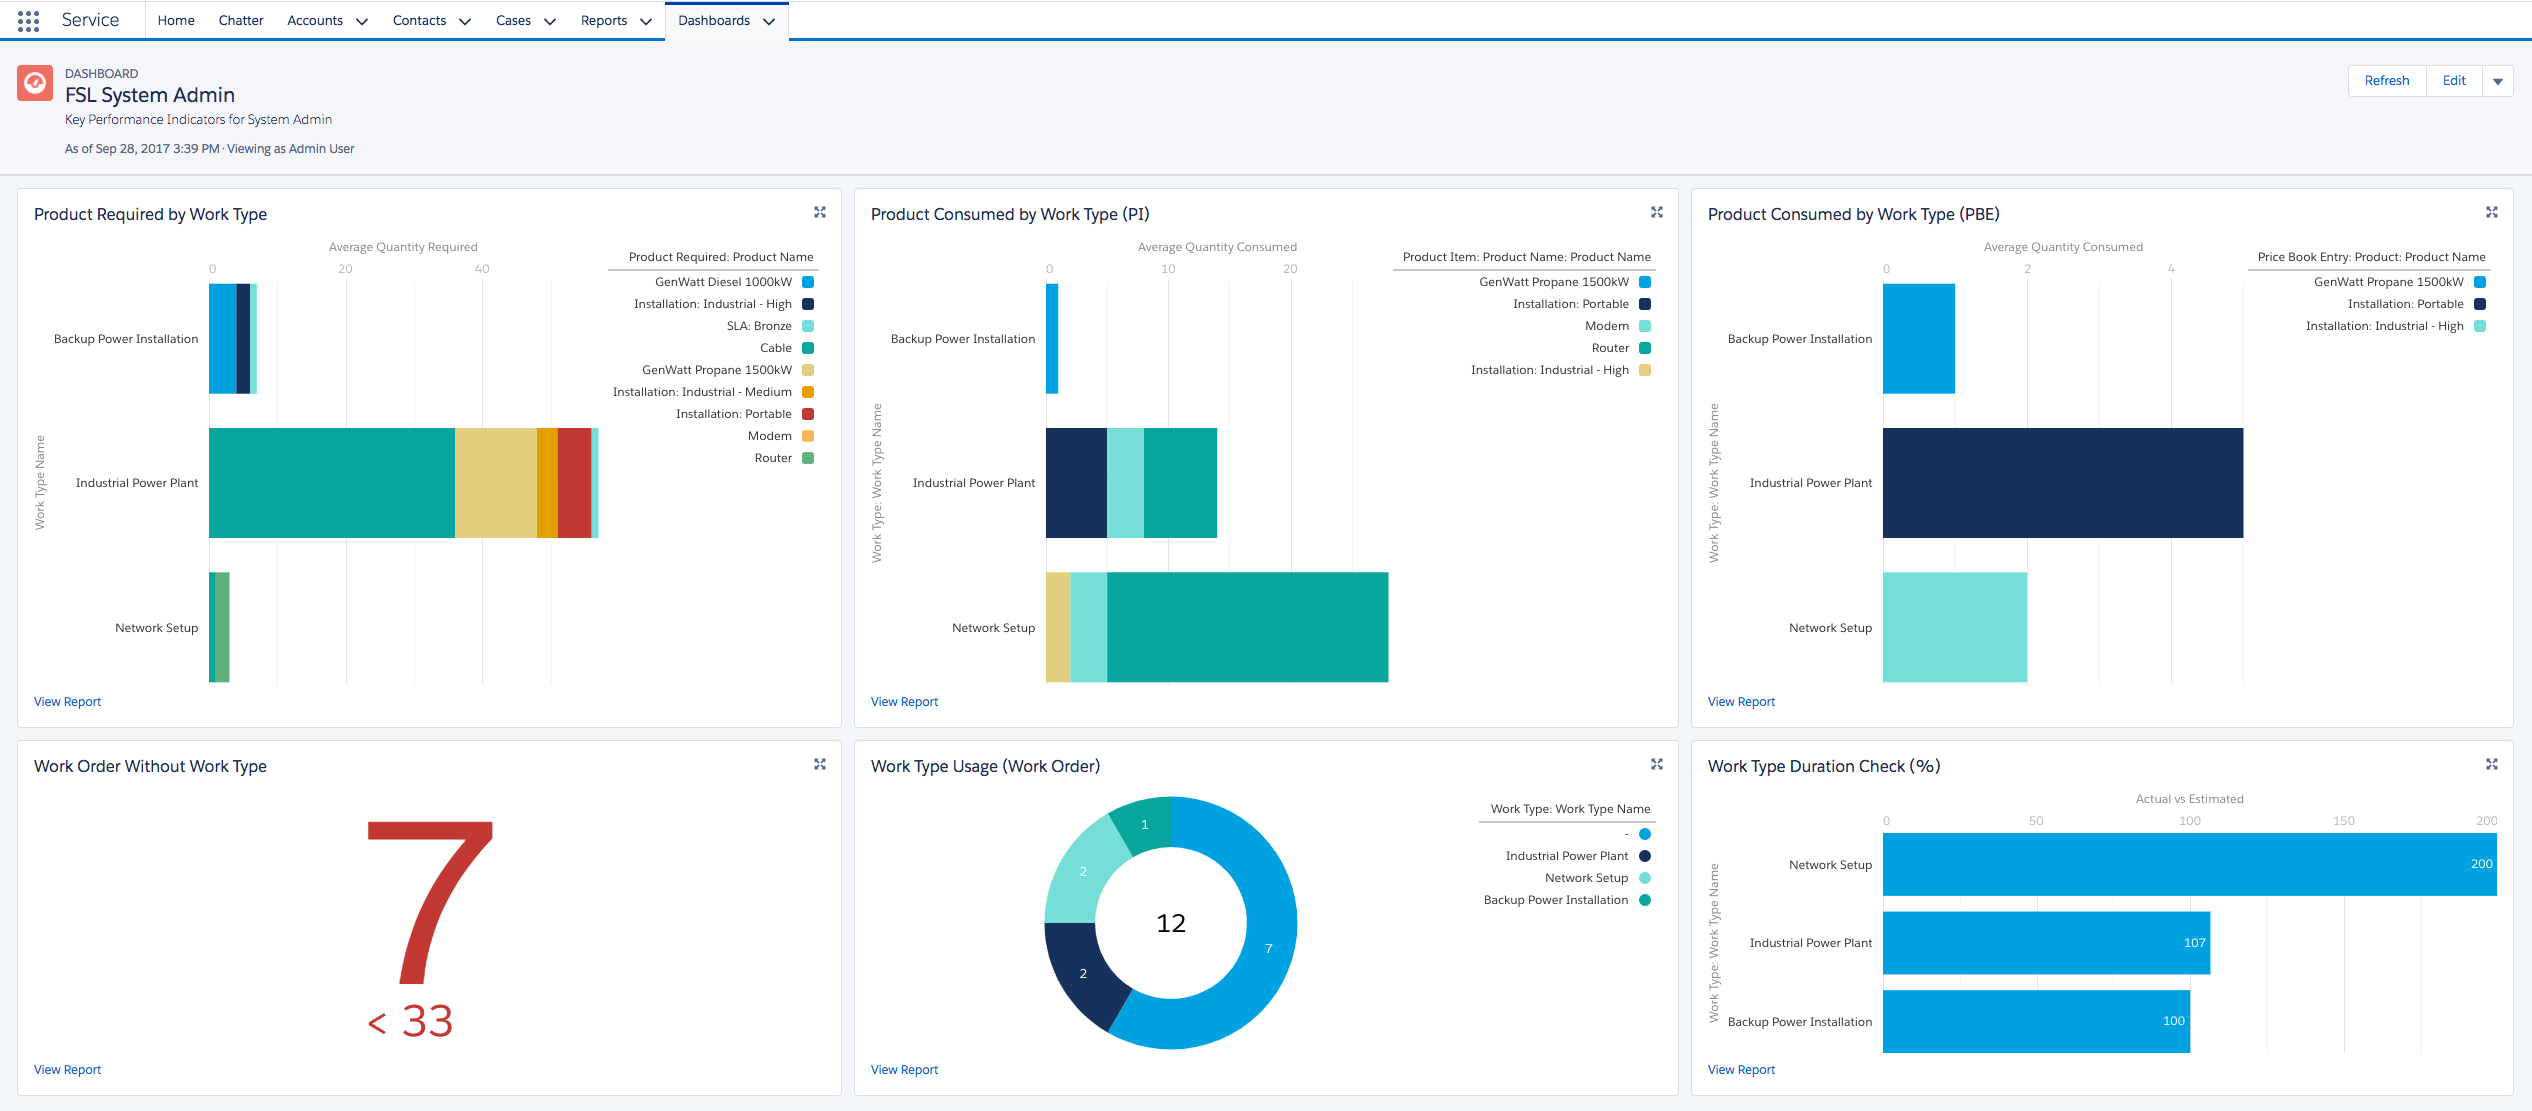
6: Go Visual with Dashboards
Dashboards provide a visual representation of your data and can be more impactful than raw numbers. Use charts, graphs, and gauges to convey trends and metrics effectively. Customize dashboards to display relevant information for different user roles.
Data Visualization Best Practices
Effective data visualization is crucial for conveying information clearly and intuitively. Here are some data visualization best practices:
7: Chart Choice Matters
Selecting the appropriate chart type is essential. For example, use bar charts for comparisons, line charts for trends over time, and pie charts for showing parts of a whole. Ensure that your choice aligns with your data and objectives.
8: Simplicity Rules
Simplicity is key to effective data visualization. Avoid cluttering charts and dashboards with unnecessary elements. Use color, size, and labels sparingly to avoid confusion.
9: Stay on Brand
Maintain a consistent color palette, fonts, and branding elements across your reports and dashboards. Consistency enhances readability and helps users associate data with your organization’s identity.
10: Add Context
Always include contextual information such as titles, axis labels, and legends. Explain any abbreviations or acronyms used. Make it easy for users to understand what they are looking at.
11: Mobile-Friendly
Everyone’s on their phones these days. Make sure your reports and dashboards look good on mobiles too.

Deriving Valuable Insights from Salesforce Data
To extract valuable insights from your Salesforce data – from something like Salesforce’s own Data Cloud – follow these steps:
12: Keep It Fresh
Set up a schedule for reviewing and updating your reports and dashboards. Data can become outdated quickly, and staying up-to-date ensures the accuracy of your insights.
13: Spot Trends
Look for trends and anomalies in your data. Use historical data to identify patterns that can inform future decisions. For instance, spotting a decline in sales for a particular product could lead to a targeted marketing strategy.
14: Use Predictive Magic
Leverage predictive analytics tools and machine learning models available within Salesforce to forecast future trends, customer behavior, and sales opportunities. These insights can drive proactive decision-making.
15: Collaborate and Share Insights
Encourage collaboration by sharing reports and dashboards with relevant teams. Salesforce offers sharing options to ensure that the right people have access to critical insights. Foster a data-driven culture within your organization.
Summary
Effectively harnessing Salesforce data through reports, dashboards, and data visualization is crucial for making informed decisions, improving processes, and driving business growth. By defining clear objectives, using the right tools, and following best practices, you can unlock valuable insights that can transform your organization. Remember that data analysis is an ongoing process, and regular reviews and updates are essential to stay ahead in today’s competitive landscape.
How AdVic Can Help
If you’re striving for a way to securely transform and share your data in powerful, interactive dashboards, so everyone in your organization can ask and answer their own questions right from a browser, tablet or phone, and get it done without hours of coding or waiting on your IT team, you need to speak with Ad Victoriam today!
Related Resources:
The Analytics Power Inside Salesforce Tableau (Podcast)
Subscribe to the AdVic Salesforce Blog on Feedly:

*Images courtesy of Salesforce.com