How to Visualize Sales Goals by Adding Targets to Salesforce Reports and Dashboards
It is no secret that visualization plays a key factor in one’s path to achieving their goals.
Robert Collier, an inspirational writer and author of the bestseller The Secret of the Ages (1926), once said “Visualize this thing that you want, see it, feel it, believe in it. Make your mental blueprint and begin to build it.” In order to accomplish any goal that you have for yourself, you must know where it is you are trying to go in order to successfully get there.
Sales representatives, by nature, are some of the most goal-oriented users of Salesforce, since their primary role as an employee is to reach their respective quota. These quota amounts and types can be different for each individual based on their role within the company.
So how do you go about tracking and displaying all of these various values as targets in Salesforce?
There are a few ways you can apply these targets to each individual User Record in Salesforce depending on what these targets relate to, and the relationship between the Users that share the same specific target values:
Unique Targets:
No Established Relationship Between the Target Values and the Users They Are Applied To
To add unique targets to reports and dashboards in Salesforce you must first start by creating a custom field with the Currency, Number, or Percent type on the User object. It is best to use the “Number” field type if you plan on adding a target to a report where data is measured by record count. It is also helpful to specify the timeframe for this particular target within the field name of these new custom target fields (i.e. Field Label: # of Activities Completed (Monthly), or # of Activities Completed (Weekly)).
You can then populate these newly added target fields with values for each employee on their User Record page, or through the data loader. Once these fields are populated with their specific target values, you can then reference these targets by creating a formula field on the object which the target is intended to track against. So if a field is intended to track the # of Activities Completed for the month, you would create a Custom Activity Formula Field of Number type which references the value specified for this target from the related Owner (User Object) fields.
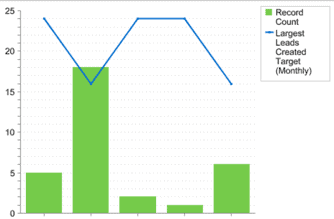
Once the field that captures the target (on User Object) and the field that references the target (Object you want to include target in reports for) have been completed, you are ready to add them to any report where applicable. In order to show these values on a chart or dashboard component, you must summarize the report by the record owner and also summarize the target field column with the MAX function. This will then allow you to plot these targets against the actual performance of the User by either using the “Combination Chart” function in the Vertical Bar Chart specific to the report, or the Vertical Bar Chart dashboard component.
Correlated Targets:
Targets Apply to Users Based on Role or Other Segmenting Fields
If this is the case, then we can actually use a custom formula field on the User Object and specify the target values using an IF or CASE function which matches the targets based on their respective Role or other segmenting field value within the User Object.
Aside from this difference in the construction of the target field(s) on the User Object, all other steps are the same as above in order to add your targets to reports and dashboards in Salesforce.
We hope these simple Salesforce tips help you visualize goals and achieve success. For more in-depth sales knowledge, read up on Salesforce Solutions for Businesses 101 and contact our Salesforce consultants today.